"Data" is the key | Computer Vision Image 2D/3D Image Datasets| Medical Radiology | LIDAR (3D optical scanning) | Seismic Images | Satellite Images (Raster/Vector)
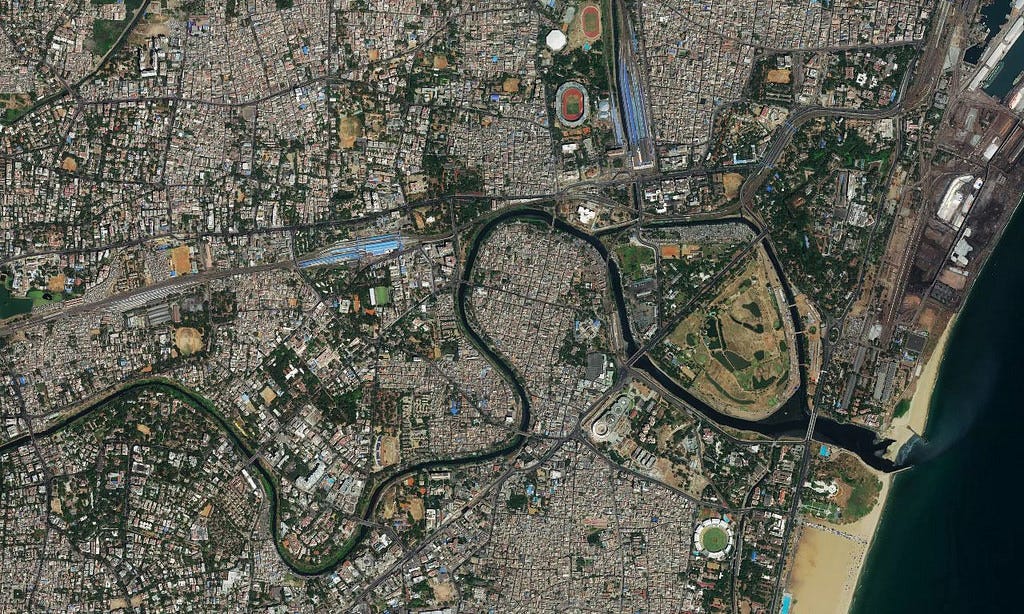
Satellite Images

- Satellite imagery are images of Earth or other planets collected by imaging satellites operated by governments and businesses around the world. Satellite imaging companies sell images by licensing them to governments and businesses such as Apple Maps and Google Maps.
- Satellite images are one of the most powerful and important tools used by the meteorologist. They are essentially the eyes in the sky. These images reassure forecasters to the behavior of the atmosphere as they give a clear, concise, and accurate representation of how events are unfolding. Forecasting the weather and conducting research would be extremely difficult without satellites. Data taken at stations around the country is limited in its representations of atmospheric motion. It is still possible to get a good analysis from the data, but because the stations are separated by hundreds of miles significant features can be missed. Satellite images aid in showing what can not be measured or seen. In addition the satellite images are viewed as truth. There is no chance for error. Satellite images provide data that can be interpreted "first-hand".
Libraries of python
-
pip install geoio
Difference between Raster and Vector Images
| Raster Images | Vector Images |
| raster graphics are composed of pixels | vector graphics are composed of paths |
| A raster graphic, such as a gif or jpeg, is an array of pixels of various colors, which together form an image | A vector graphic, such as .svg, .eps file or Adobe Illustrator file, is composed of paths, or lines, that are either straight or curved. |
| Raster graphics become "blocky," since each pixel increases in size as the image is made larger. This is why logos and other designs are typically created in vector format -- the quality will look the same on a business card as it will on a billboard. | The data file for a vector image contains the points where the paths start and end, how much the paths curve, and the colors that either border or fill the paths. Because vector graphics are not made of pixels, the images can be scaled to be very large without losing quality. |

